
Links & graph
Graph view
The whole vault as a picture — notes as dots, links as lines — with filters, forces, colour groups, search, time travel and a local graph per note.
WhereRibbon → graph icon, or ⌘G. Local graph: right sidebar → the branching icon
What you are looking at
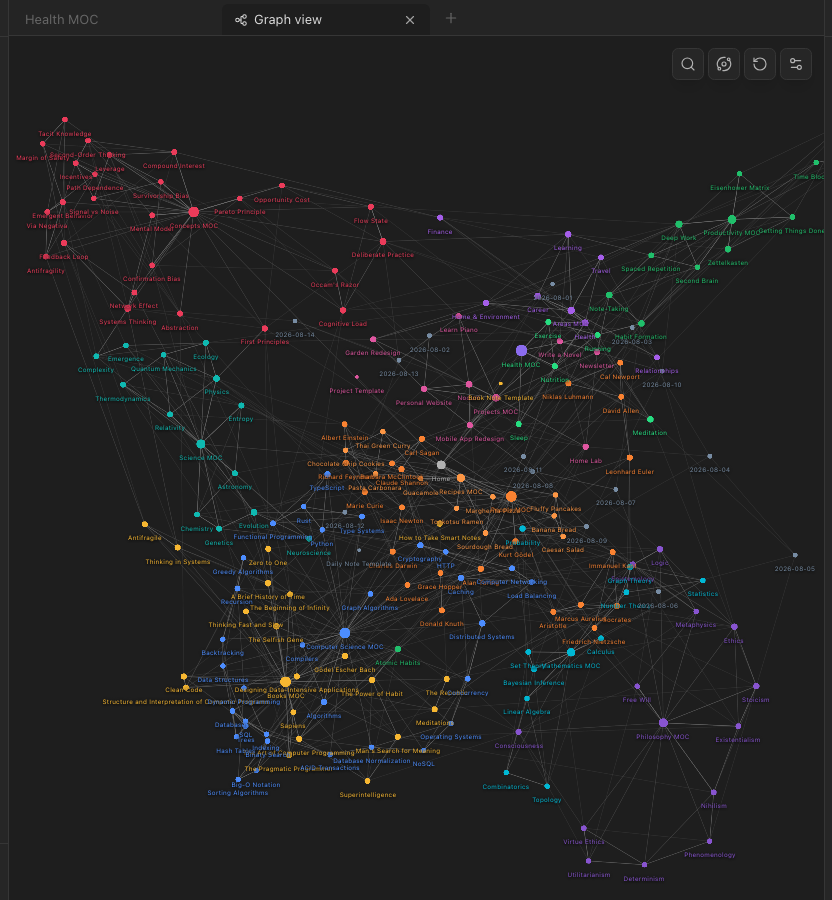
Every note is a dot; every link is a line between two dots. Dots with more links are bigger. Notes without links float at the edge. Unresolved links show as ghost dots — click one and the note is created.
Moving around
Scroll to zoom, drag the background to pan, drag a dot to move it (the rest keeps drifting gently while you hold it). Hover a dot: it and its neighbours light up, their names appear, and everything else steps back — dimmer, but still readable. Click a dot to open that note beside the graph.
Hovering a file in the explorer, or a link in a note, makes that note's dot breathe in the graph — so you can find where something sits without leaving what you were reading. The note you are typing in breathes too.
The settings popover
The sliders icon at the top-right opens the controls.
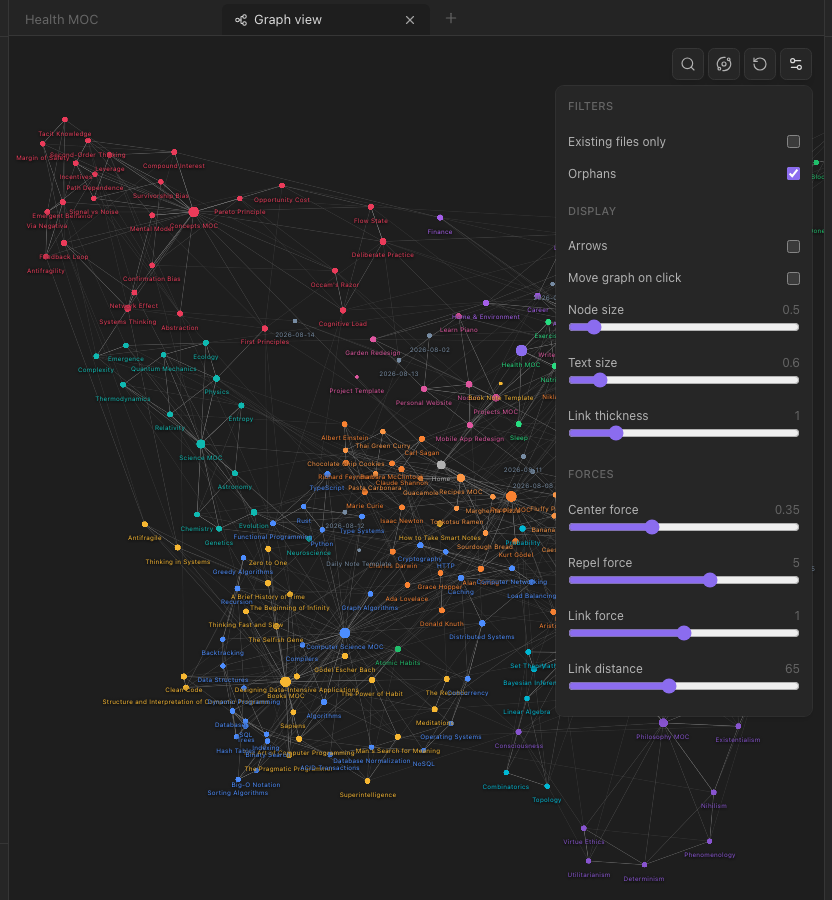
- Filters — hide unresolved links, hide orphans.
- Display — arrows on links, node size, text size for the labels, link thickness.
- Forces — centre pull, repulsion, link strength, link distance. Drag a slider and the layout re-settles live.
- Groups — colour dots that match a query:
tag:#book,path:Projects,file:Daily, or plain text. The demo workspace ships with thirteen. - Time travel — a slider (and a play button) that reveals notes in the order they were created, so you can watch the vault grow.
The magnifier at the top-right filters by search — matches stay bright, the rest dims, nothing moves. The reset arrow restores every setting; the orbit icon rearranges the layout into a fresh sphere.
Colours
Dots take a colour from, in order: the graph group they match, the folder colour that flows down to their note, or the default grey. Colour the top folders and the graph organises itself.
Local graph
The right sidebar's branching icon shows just the note you are reading and its neighbours; a Depth slider (1–5) chooses how many steps out. It has no settings popover, search or reset of its own — it uses the main graph's saved settings and colours.
Layouts are remembered
Close and reopen the graph and the dots are where you left them. New notes appear beside the notes they link to rather than shuffling everything.